English interface
The documentation body is currently provided mainly in Chinese. API names and code examples remain unchanged.
showConnData
可视化颗粒群的连接状态
语法
showConnData(mPos,cList,cW,cC)
showConnData(mPos,cList)
showConnData(mPos,cList,cW)
showConnData(...,M)
showConnData(AX,...)
H = showConnData(...)
描述
showConnData(mPos, cList) 根据点坐标 mPos 和点对 cList 显示连接,默认使用相同宽度与颜色的线段。
showConnData(mPos, cList, cW) 使用不同宽度的窄矩形或圆管显示连接,宽度由 cW 控制。
showConnData(mPos, cList, cW, cC) 使用不同宽度和颜色显示连接,宽度由 cW 控制,颜色由 cC 控制。连接上的插值着色能力以当前 MatDEM 版本实现为准。
showConnData(__, M) 使用 M 指定的标记类型('line'、'rect' 或 'tube')。
showConnData(AX, __) 在坐标区 AX 中绘图,而不是使用当前坐标区。
H = showConnData(__) 返回 PATCH 或 SURFACE 句柄 H。
__ = showConnData(__, pvpairs) 设置指定的图形属性,可在一条语句中设置多个属性值。
示例——基本图元与数据可视化
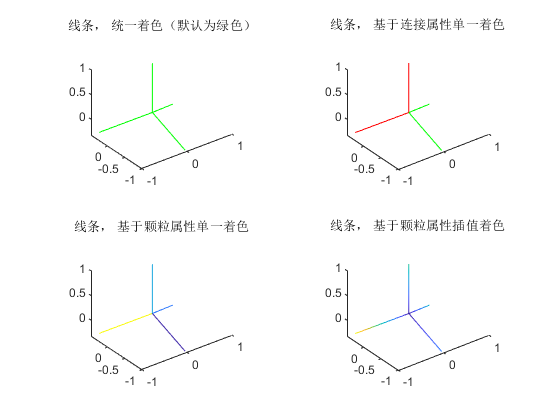
线条(1维)
无线宽, 数据可视化时仅映射为颜色
mPos = [zeros(1,3);[sqrt(8)/3*cosd(30:120:270)',sqrt(8)/3*sind(30:120:270)',zeros(3,1)-1/3];0,0,1];
cList = [1,2;1,3;1,4;1,5];
mValue = rand(5,1);
cValue = rand(4,1);

nexttile
showConnData(mPos, cList, 'line');
title('线条, 统一着色(默认为绿色)');
nexttile
showConnData(mPos, cList, 0, cValue, 'EdgeColor', 'flat');
colormap(gca, [0,1,0;1,0,0]);
title('线条, 基于连接属性单一着色');
nexttile
showConnData(mPos, cList, 0, mValue);
title('线条, 基于颗粒属性单一着色');
nexttile
showConnData(mPos, cList, 0, mValue,'EdgeColor','interp');
title('线条, 基于颗粒属性插值着色');
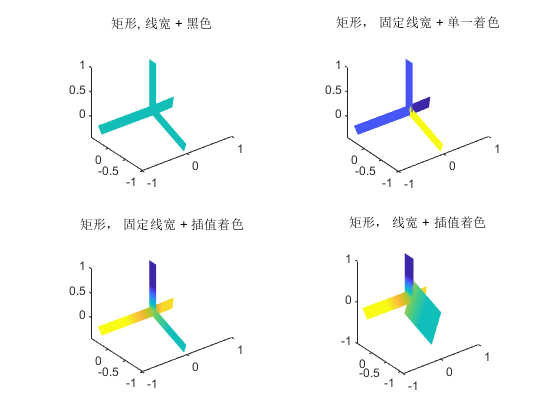
矩形(2维)
数据可视化时可映射为宽度、颜色或(透明度)
mPos = [zeros(1,3);[sqrt(8)/3*cosd(30:120:270)',sqrt(8)/3*sind(30:120:270)',zeros(3,1)-1/3];0,0,1];
cList = [1,2;1,3;1,4;1,5];
mValue = rand(5,1);
cValue = rand(4,1);

figure;
nexttile
showConnData(mPos, cList, 'rect');
title('矩形, 线宽 + 黑色');
nexttile
showConnData(mPos, cList, 1, cValue, 'rect', 'FaceColor', 'flat');
title('矩形, 固定线宽 + 单一着色');
nexttile
showConnData(mPos, cList, 1, mValue, 'rect');
title('矩形, 固定线宽 + 插值着色');
nexttile
showConnData(mPos, cList, cValue, mValue, 'rect','FaceColor','interp');
title('矩形, 线宽 + 插值着色');
snapnow;
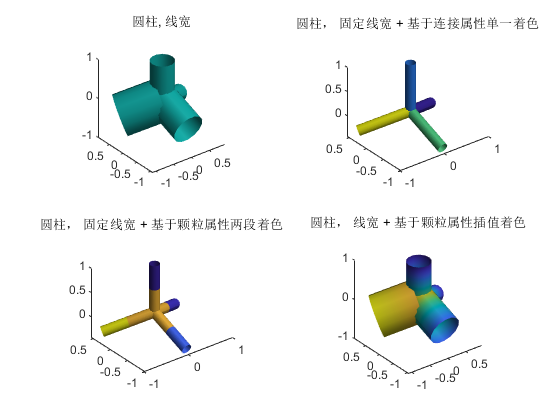
圆柱
数据可视化时可映射为宽度、颜色或(透明度) 三维时可考虑光照增强立体感
figure;
mPos = [zeros(1,3);[sqrt(8)/3*cosd(30:120:270)',sqrt(8)/3*sind(30:120:270)',zeros(3,1)-1/3];0,0,1];
cList = [1,2;1,3;1,4;1,5];
mValue = rand(5,1);
cValue = rand(4,1);

nexttile
showConnData(mPos, cList, cValue);
camlight;
title('圆柱, 线宽');
nexttile
showConnData(mPos, cList, 1, cValue,'FaceColor', 'flat');
camlight;
title('圆柱, 固定线宽 + 基于连接属性单一着色');
nexttile
showConnData(mPos, cList, 1, mValue);
camlight;
title('圆柱, 固定线宽 + 基于颗粒属性两段着色');
nexttile
showConnData(mPos, cList, cValue, mValue,'FaceColor','interp');
camlight;
title('圆柱, 线宽 + 基于颗粒属性插值着色');
snapnow;
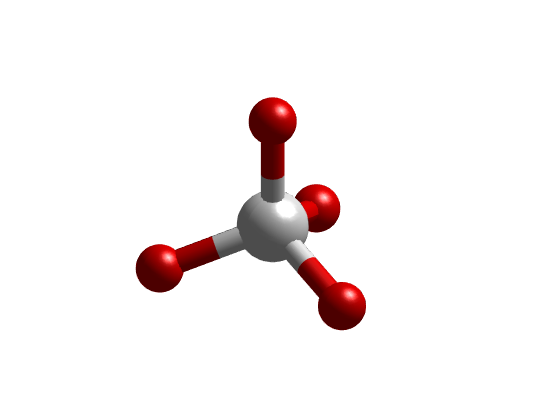
CH4球棍模型
mPos = [zeros(1,3);[sqrt(8)/3*cosd(30:120:270)',sqrt(8)/3*sind(30:120:270)',zeros(3,1)-1/3];0,0,1];
cList = [1,2;1,3;1,4;1,5];
mValue = [2,1,1,1,1]';

figure
s = struct('X',mPos(:,1),'Y',mPos(:,2),'Z',mPos(:,3),'R',0.2*[1.5;ones(4,1)],'groupId',mValue);
bfs.show(s);

hold on
showConnData(mPos, cList, 1, mValue, 'tube','FaceLighting','gouraud');
colormap([1,0,0;1,1,1]);axis off;
hold off;
% snapnow;
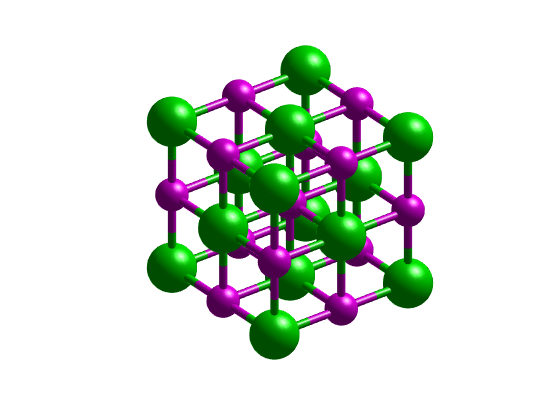
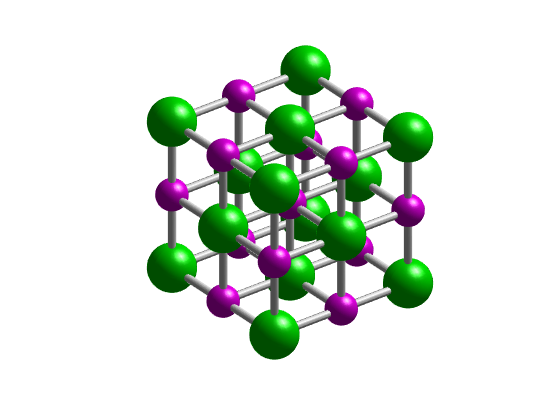
NaCl球棍模型
n=3;
[mX,mY,mZ]=ndgrid(1:n);
mPos=[mX(:),mY(:),mZ(:)];

mI=reshape(1:length(mPos),size(mX));
cList=[reshape(mI(1:end-1,:,:),[],1),reshape(mI(2:end,:,:),[],1);
    reshape(mI(:,1:end-1,:),[],1),reshape(mI(:,2:end,:),[],1);
    reshape(mI(:,:,1:end-1),[],1),reshape(mI(:,:,2:end),[],1)];

mValue =  mod(mI(:),2)+1;
s = struct('X',mPos(:,1),'Y',mPos(:,2),'Z',mPos(:,3),'R',0.2*(mValue/2+0.5),'groupId',mValue);

% subplot(1,2,1)
bfs.show(s);
hold on
showConnData(mPos, cList, 1/2, mValue,'FaceLighting','gouraud');
colormap([1,0,1;0,1,0]);axis off;
hold off;
snapnow;

% subplot(1,2,2)
bfs.show(s);
hold on
h = showConnData(mPos, cList, 1/2, 3,'FaceLighting','gouraud');
colormap([1,0,1;0,1,0;1,1,1]);axis off;
hold off;
snapnow;

%}
另请参阅
coneplot, scatter, scatter3
Copyright 2018-2024 The MatDEM teams.