Instructions of PCAS pore identification operation
Automatic analysis of the pore system

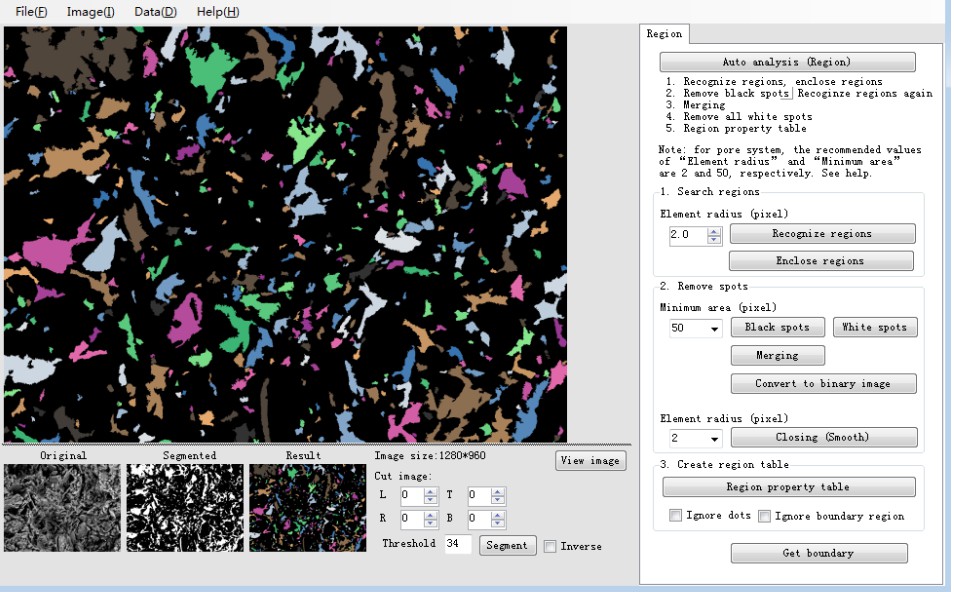
Figure 1 main operation window of PCAS
1. Click File > Open to open an SEM image of the clay;
2. The program pops up the "Segmentation" dialog box and adjusts the position of the left slider to set "Threshold". Finally, select "Reverse" and click "OK". Note that in software, the white areas represent the pores and the black areas represent the soil;
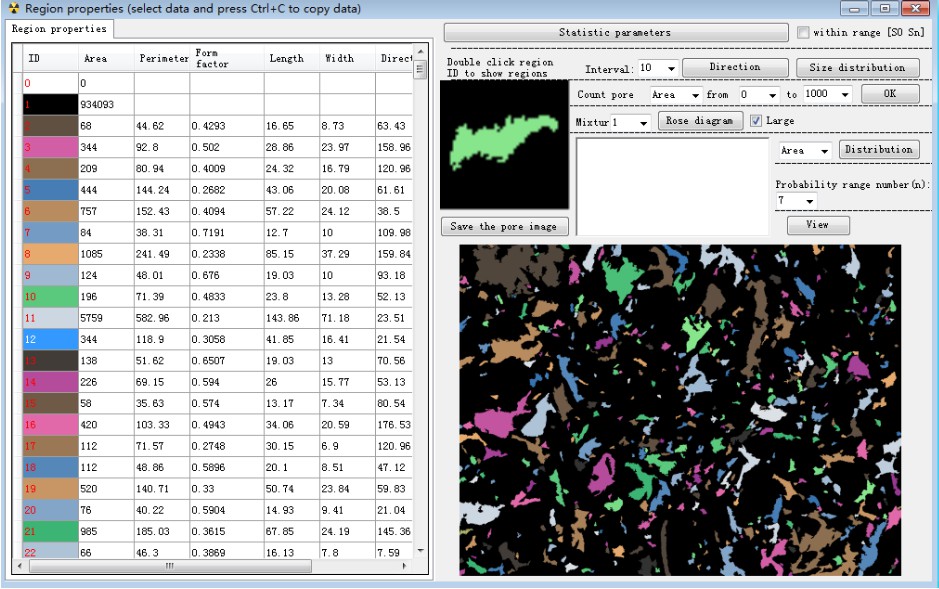
3. Go back to the main program, set "Element radius" to 2.1, "Minimum area" to 50, and click "Auto analysis". according to the size of the image, the “Region properties” table is usually popped up in a few seconds, giving the geometry data for each void region in the image.

Figure 2 pore system geometry
4. Click on “Statistics” to get the statistical parameters of the pore system. The binary image of the analyzed image and the recognition result image are automatically saved in the folder where the original image is located.
![ZI%GFI]G~J[UPMXE4_M9R@C.jpg ZI%GFI]G~J[UPMXE4_M9R@C.jpg](http://matdem.com/upload/image/20171202/15122000008168409.jpg)
Figure 3 statistical parameters of pore system
